
Much artificial-intelligence research addresses the problem of making predictions based on large data sets. An obvious example is the recommendation engines at retail sites like Amazon and Netflix.
But some types of data are harder to collect than online click histories — information about geological formations thousands of feet underground, for instance. And in other applications — such as trying to predict the path of a storm — there may just not be enough time to crunch all the available data.
Dan Levine, an MIT graduate student in aeronautics and astronautics, and his advisor, Jonathan How, the Richard Cockburn Maclaurin Professor of Aeronautics and Astronautics, have developed a new technique that could help with both problems. For a range of common applications in which data is either difficult to collect or too time-consuming to process, the technique can identify the subset of data items that will yield the most reliable predictions. So geologists trying to assess the extent of underground petroleum deposits, or meteorologists trying to forecast the weather, can make do with just a few, targeted measurements, saving time and money.
Levine and How, who presented their work at the Uncertainty in Artificial Intelligence conference this week, consider the special case in which something about the relationships between data items is known in advance. Weather prediction provides an intuitive example: Measurements of temperature, pressure, and wind velocity at one location tend to be good indicators of measurements at adjacent locations, or of measurements at the same location a short time later, but the correlation grows weaker the farther out you move either geographically or chronologically.
Graphic content
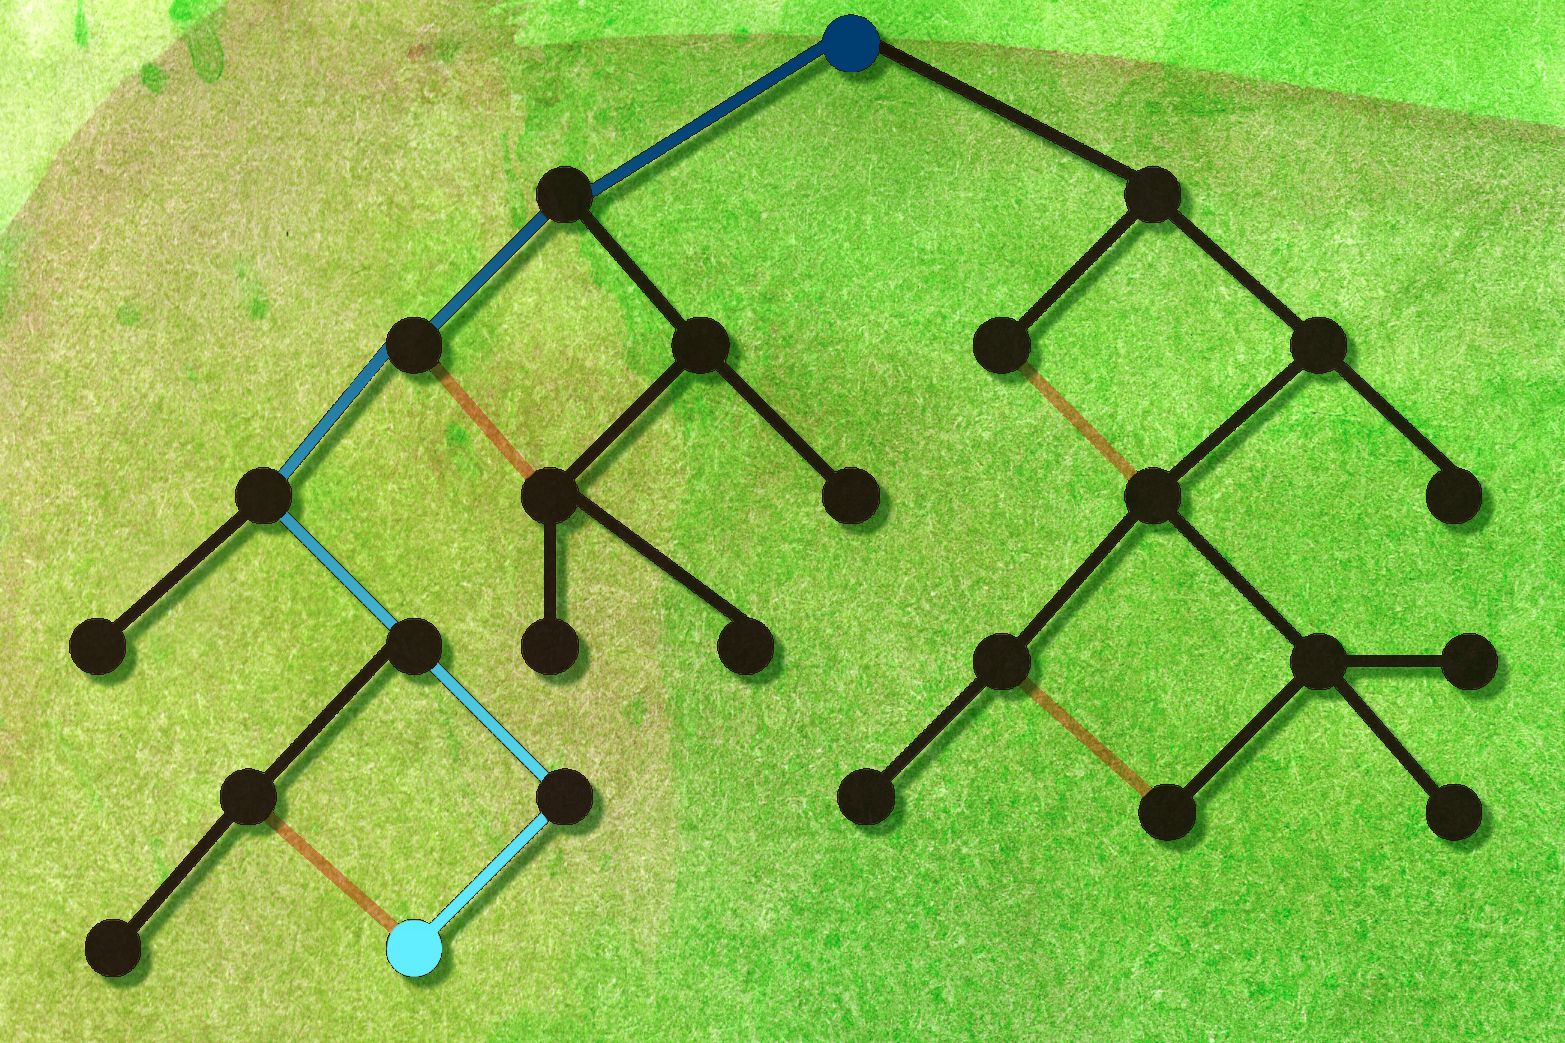
Such correlations can be represented by something called a probabilistic graphical model. In this context, a graph is a mathematical abstraction consisting of nodes — typically depicted as circles — and edges — typically depicted as line segments connecting nodes. A network diagram is one example of a graph; a family tree is another. In a probabilistic graphical model, the nodes represent variables, and the edges represent the strength of the correlations between them.
Levine and How developed an algorithm that can efficiently calculate just how much information any node in the graph gives you about any other — what in information theory is called “mutual information.” As Levine explains, one of the obstacles to performing that calculation efficiently is the presence of “loops” in the graph, or nodes that are connected by more than one path.
Calculating mutual information between nodes, Levine says, is kind of like injecting blue dye into one of them and then measuring the concentration of blue at the other. “It’s typically going to fall off as we go further out in the graph," Levine says. "If there’s a unique path between them, then we can compute it pretty easily, because we know what path the blue dye will take. But if there are loops in the graph, then it’s harder for us to compute how blue other nodes are because there are many different paths.”
So the first step in the researchers’ technique is to calculate “spanning trees” for the graph. A tree is just a graph with no loops: In a family tree, for instance, a loop might mean that someone was both parent and sibling to the same person. A spanning tree is a tree that touches all of a graph’s nodes but dispenses with the edges that create loops.
Betting the spread
Most of the nodes that remain in the graph, however, are “nuisances,” meaning that they don’t contain much useful information about the node of interest. The key to Levine and How’s technique is a way to use those nodes to navigate the graph without letting their short-range influence distort the long-range calculation of mutual information.
That’s possible, Levine explains, because the probabilities represented by the graph are Gaussian, meaning that they follow the bell curve familiar as the model of, for instance, the dispersion of characteristics in a population. A Gaussian distribution is exhaustively characterized by just two measurements: the average value — say, the average height in a population — and the variance — the rate at which the bell spreads out.
“The uncertainty in the problem is really a function of the spread of the distribution,” Levine says. “It doesn’t really depend on where the distribution is centered in space.” As a consequence, it’s often possible to calculate variance across a probabilistic graphical model without relying on the specific values of the nodes. “The usefulness of data can be assessed before the data itself becomes available,” Levine says.


