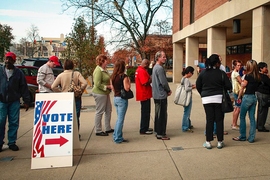
No one likes waiting in line — and on Election Day in 2012, an estimated 750,000 potential voters across the U.S. left their polling places without voting because the lines seemed too long.
Now a unique MIT-led project aims to solve this problem by using Election Day field research to see exactly which parts of the voting process are causing the greatest bottlenecks.
“Lines really do cause problems,” observes Charles Stewart, the Kenan Sahin Distinguished Professor at MIT and a voting expert who is leading the project. “Lines cause people to walk away and not vote, and there’s very strong evidence they cause people to lose confidence in the electoral process. And standing in line costs people money.”
But there is good news, as Stewart sees it: Long lines are a problem that has been addressed in other spheres of life using academic tools. If those concepts can be brought to bear on polling places, the U.S. voting process could improve through a few logistical tweaks.
“There is a science of line management, queueing theory, and that science is applied in many settings, but rarely in the election setting,” Stewart says. For that matter, he notes, there is a “thin history of research in this area,” with only a few studies, mostly in California and Ohio, trying to examine how to improve the voting process. (MIT engineering systems professor Richard Larson, notes Stewart, is among the few who have examined the topic.)
So today, Election Day, researchers and students from MIT and four other universities are fanning out to polling places in four states — Florida, Massachusetts, New Mexico, and Virginia — to gather data about lines and procedures. They plan to apply that data to an “election toolkit” of voting-line models, and see what fixes seem most effective.
“There’s a real hope we can do something about it,” Stewart says.
“Problems happen one precinct at a time”
The origins of the current project date to Election Day in 2012, when long lines led President Barack Obama to form the Presidential Commission on Election Administration (PCEA). One of the groups assisting the commission was the Caltech/MIT Voting Technology Project, founded after the 2000 presidential election recount in Florida had highlighted problems with voting machines.
The presidential commission’s report, filed earlier in 2014, addressed many voting issues, not just lines, but the commission viewed lines as a problem that applied research could help address.
“They saw that it was important to ground solutions to line problems in science and technology,” Stewart says. “The commission [was] trying to approach as many of the issues on its plate as possible from a solid scientific or research background, because of how politicized everything has gotten these days, especially issues in administering elections.”
The project at hand has grown to include researchers from George Mason University, Virginia Commonwealth University, the University of Central Florida, and the University of New Mexico, where a related study was already running.
The researchers will gather data on things like rates of voter arrival, the series of procedures voters must go through in each location, and the time spent on all those steps.
“We’re looking at simple things, arrival rates and bottlenecks at the polling places, but every single place we’re going is unique in how the jurisdictions or states define the voting process,” Stewart says.
In Massachusetts, for instance, voters must formally check in, then often fill out bubbles on a piece of paper in the polling booth, before moving to another location to submit the paper ballot and formally check out of the polling precinct. By contrast, in Richmond, Va., one place the researchers are studying, voters just check in, vote electronically, and leave.
“There are something like 180,000 precincts in America,” Stewart says. “But the problems that give rise to long lines happen one precinct at a time. So you really have to have people in precincts to do the measurements and gather the data. It’s intrinsically a labor-intensive process, so it’s no surprise this kind of research has rarely been done before.”
Leading models
Having gathered data on Election Day, the researchers will then see it how it fits at least three models. For instance, one model, developed by Stephen Graves, an operations research professor at the MIT Sloan School of Management, estimates how many poll workers are needed at each step of the voting process — such as checking in registered voters — to avoid long lines.
The research team will first present its results to election officials in the areas they are studying, then issue a report in 2015. Stewart is also principal investigator on another research project compiling survey data in which voters report how long they waited at their precincts.
Stewart acknowledges that many precincts will see shorter lines in this midterm election than they would in a presidential election, but suggests the fundamentals of the research problem remain the same.
“The service times [at the polling place] are more or less constant regardless of the type of election,” he notes. “We can take what we learned in the midterm election and then [ask], ‘What if twice as many voters were taking this amount of time to vote?’ If we have fundamental data about arrival rates and service times, then we can model what’s likely to happen in a presidential year.”
The teams of researchers, Stewart notes, are only operating in places where observation of this nature is legally allowed, and have all had their presence as observers at the polls approved by local election officials; the research project has no influence on behavior of voters.
The project is receiving funding from the Democracy Fund, a nonprofit organization that addresses issues concerning participation in democracy.


