
A new analysis by MIT researchers shows the places in the U.S. where jobs are most linked to fossil fuels. The research could help policymakers better identify and support areas affected over time by a switch to renewable energy.
While many of the places most potentially affected have intensive drilling and mining operations, the study also measures how areas reliant on other industries, such as heavy manufacturing, could experience changes. The research examines the entire U.S. on a county-by-county level.
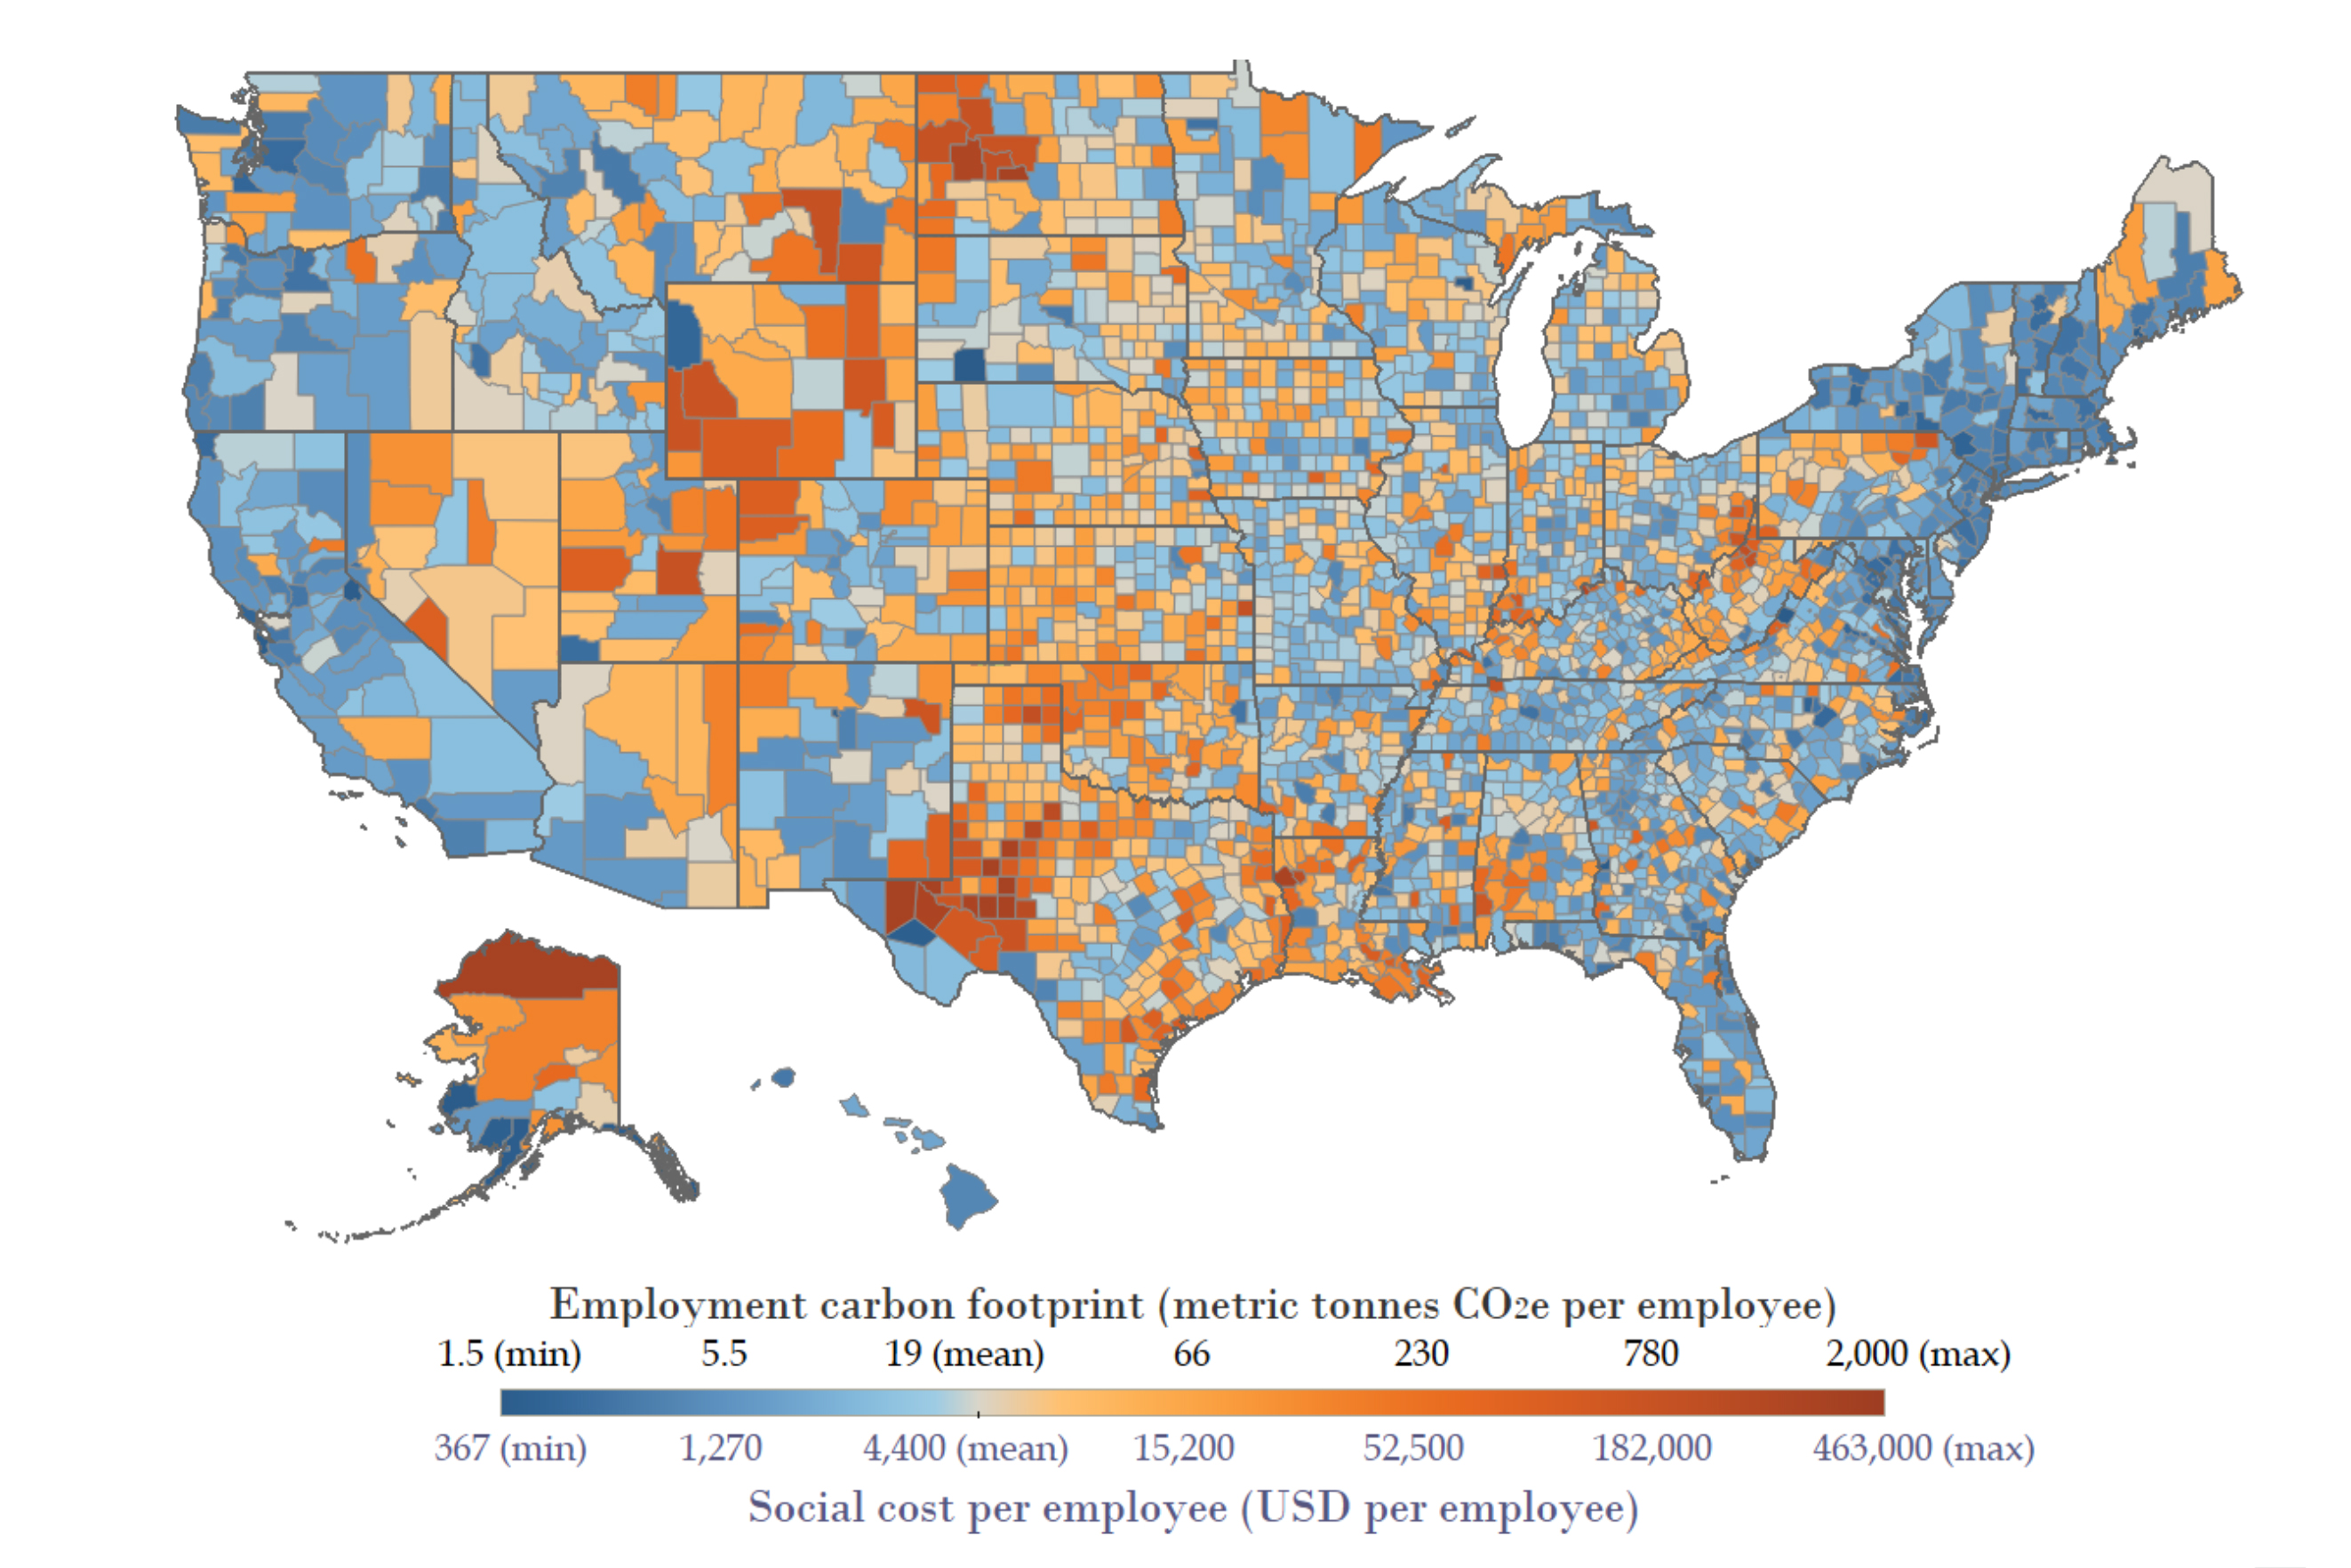
“Our result is that you see a higher carbon footprint for jobs in places that drill for oil, mine for coal, and drill for natural gas, which is evident in our maps,” says Christopher Knittel, an economist at the MIT Sloan School of Management and co-author of a new paper detailing the findings. “But you also see high carbon footprints in areas where we do a lot of manufacturing, which is more likely to be missed by policymakers when examining how the transition to a zero-carbon economy will affect jobs.”
So, while certain U.S. areas known for fossil-fuel production would certainly be affected — including west Texas, the Powder River Basin of Montana and Wyoming, parts of Appalachia, and more — a variety of industrial areas in the Great Plains and Midwest could see employment evolve as well.
The paper, “Assessing the distribution of employment vulnerability to the energy transition using employment carbon footprints,” is published this week in Proceedings of the National Academy of Sciences. The authors are Kailin Graham, a master’s student in MIT’s Technology and Policy Program and graduate research assistant at MIT’s Center for Energy and Environmental Policy Research; and Knittel, who is the George P. Shultz Professor at MIT Sloan.
“Our results are unique in that we cover close to the entire U.S. economy and consider the impacts on places that produce fossil fuels but also on places that consume a lot of coal, oil, or natural gas for energy,” says Graham. “This approach gives us a much more complete picture of where communities might be affected and how support should be targeted.”
Adjusting the targets
The current study stems from prior research Knittel has conducted, measuring carbon footprints at the household level across the U.S. The new project takes a conceptually related approach, but for jobs in a given county. To conduct the study, the researchers used several data sources measuring energy consumption by businesses, as well as detailed employment data from the U.S. Census Bureau.
The study takes advantage of changes in energy supply and demand over time to estimate how strongly a full range of jobs, not just those in energy production, are linked to use of fossil fuels. The sectors accounted for in the study comprise 86 percent of U.S. employment, and 94 percent of U.S. emissions apart from the transportation sector.
The Inflation Reduction Act, passed by Congress and signed into law by President Joe Biden in August 2022, is the first federal legislation seeking to provide an economic buffer for places affected by the transition away from fossil fuels. The act provides expanded tax credits for economic projects located in “energy community” areas — defined largely as places with high fossil-fuel industry employment or tax revenue and with high unemployment. Areas with recently closed or downsized coal mines or power plants also qualify.
Graham and Knittel measured the “employment carbon footprint” (ECF) of each county in the U.S., producing new results. Out of more than 3,000 counties in the U.S., the researchers found that 124 are at the 90th percentile or above in ECF terms, while not qualifying for Inflation Reduction Act assistance. Another 79 counties are eligible for Inflation Reduction Act assistance, while being in the bottom 20 percent nationally in ECF terms.
Those may not seem like colossal differences, but the findings identify real communities potentially being left out of federal policy, and highlight the need for new targeting of such programs. The research by Graham and Knittel offers a precise way to assess the industrial composition of U.S. counties, potentially helping to target economic assistance programs.
“The impact on jobs of the energy transition is not just going to be where oil and natural gas are drilled, it’s going to be all the way up and down the value chain of things we make in the U.S.,” Knittel says. “That’s a more extensive, but still focused, problem.”
Graham adds: “It’s important that policymakers understand these economy-wide employment impacts. Our aim in providing these data is to help policymakers incorporate these considerations into future policies like the Inflation Reduction Act.”
Adapting policy
Graham and Knittel are still evaluating what the best policy measures might be to help places in the U.S. adapt to a move away from fossil fuels.
“What we haven’t necessarily closed the loop on is the right way to build a policy that takes account of these factors,” Knittel says. “The Inflation Reduction Act is the first policy to think about a [fair] energy transition because it has these subsidies for energy-dependent counties.” But given enough political backing, there may be room for additional policy measures in this area.
One thing clearly showing through in the study’s data is that many U.S. counties are in a variety of situations, so there may be no one-size-fits-all approach to encouraging economic growth while making a switch to clean energy. What suits west Texas or Wyoming best may not work for more manufacturing-based local economies. And even among primary energy-production areas, there may be distinctions, among those drilling for oil or natural gas and those producing coal, based on the particular economics of those fuels. The study includes in-depth data about each county, characterizing its industrial portfolio, which may help tailor approaches to a range of economic situations.
“The next step is using this data more specifically to design policies to protect these communities,” Knittel says.


